Data Visualization
One of the most exciting parts of the Digital Latin Library project is the development of new information visualization techniques that will introduce the field of Latin scholarship—indeed textual scholarship in general—to novel ways of approaching texts as not just things to be read, but data to be analyzed, processed, and visualized. Likewise, this project's collaboration between Latinists and computer scientists will also advance the field of visual analytics, since visual analysis of text is relatively unexplored territory.
In his work on information visualization, co-PI Chris Weaver, associate professor in the University of Oklahoma's School of Computer Science, has developed Improvise, a "fully-implemented Java software architecture and user interface that enables users to build and browse highly-coordinated visualizations interactively." He's working with four graduate research assistants to use Improvise to create and develop a number of special visualizations for use with editions in the DLL's Library of Digital Latin Texts.
- Shejuti Silvia adapted a “storyline” visualization technique for sequential information in the primary text and apparatus.
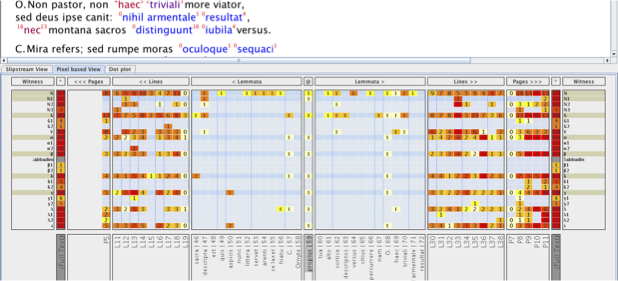
- Bharathi Asokarajan developed a “pixel-based” visualization technique to provide a compact graphical summary of all pages of an edition. The resulting visual overview allows the user to quickly scan the entire edition for locations, densities, and patterns of words in the primary text that match user-specified criteria, for instance all words noted by witnesses in a particular century.
- Sudarshan Vangala worked on a more systems-oriented thesis project, to develop an interaction server for remote multi-user interaction with running visualizations, similar to shared editing of documents in Google Docs. This capability would allow LDLT users to work in closer collaboration by allowing them to browse and query digital editions together (remotely or not, synchronously or not).
- Vamshi Sunchu wrote a thesis related to his role in implementing the data storage and querying layers of the LDLT. One possible application is automatic generation of human-readable layout (positions, lines, pages) of fractionated text. A practical solution would help us design a central view of the digital edition that, in response to interactive filtering, performs true positional elision of words and higher-level document structure, while preserving the general look (i.e., conventional text layout) of a paper edition.
Since these visualizations and others require more information processing than is practicable online, users must download a standalone desktop application that they can use with data files from the LDLT. The first release is available as a 44MB tar archive.
We are also developing "print-optimized" visualizations that will allow readers to see the data in LDLT editions in the familiar format of traditional printed critical editions. You can see an example at https://github.com/Library-of-Digital-Latin-Texts/balex/raw/main/ldlt-balex.pdf.